By Erik Vance
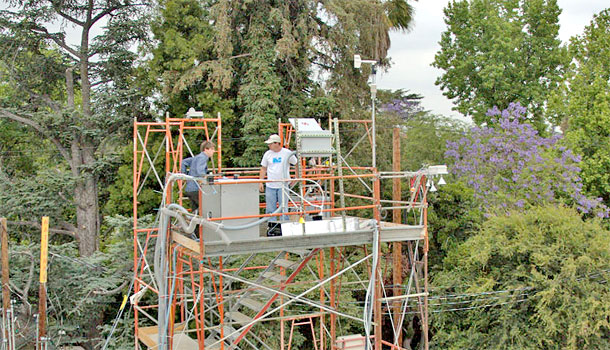
UC scientists built and worked in towers as part of the largest single atmospheric research effort in the state. The data they've collected will guide policymakers dealing with air pollution.
When geologists want to catalogue California’s rock layers, they bring a few axes, a compass and broad-brimmed hats. When biologists want to understand birds, they need decent binoculars and good hiking boots. But when scientists catalogue California’s air pollution, they bring planes, a large ship and instrument-equipped towers, some as tall as 1,500 feet.
At least that was the case with CalNex, the largest single atmospheric research endeavor in California history. The effort partnered the California Air Resources Board (ARB), the National Oceanic and Atmospheric Administration (NOAA), and numerous universities and research teams throughout the country, including many in the UC system. “It approaches the largest field study that we’ve been involved in,” says David Parrish, a lead NOAA scientist for CalNex.
The idea behind the project was to create a massive database of the state’s air over an intensive six-week period to focus on air pollution problems in its most affected regions. On the American Lung Association’s list of America’s most polluted cities last year, four of the top five spots were in California.
For those who live in places like Bakersfield, Los Angeles and Fresno, the air pollution means high levels of emphysema, asthma and cancer. Yet the project also offers opportunities to study the complex relationships between chemicals in the atmosphere as well as to lessen health effects. CalNex was an opportunity for the best atmospheric minds in the country to assemble, further their understanding of the skies and offer solutions to policymakers desperately in need of guidance.
“No group has the capability to measure all these parameters,” says Jochen Stutz, an atmospheric scientist at UCLA. “So the only way we can really do cutting-edge science is by getting together — everybody specializing in a certain type of measurement — and then combining all our efforts into these huge data sets.”
Stutz’s tower, which he co-managed with CalTech and NOAA, held 70 different monitoring devices used by 40 independent teams. Located in Pasadena, it was designed to monitor urban air pollution.
Just over the Tehachapi Mountains, Allen Goldstein and Ron Cohen of UC Berkeley lead a similar facility, this one in the agricultural Central Valley, near Bakersfield. Both towers were equipped with some of the newest and most sensitive sampling equipment in the world, as were Sutro Tower in San Francisco and another dizzying 1,500-foot-tall steel tower just south of Sacramento. Many of those devices were carefully sniffing out organic chemicals, which are largely responsible for forming ozone and aerosols, the main components of smog causing the health effects associated with air pollution.
“When people study the health effects of these pollutants, these aerosols — or ‘particulate matter’ as the EPA calls them — are the ones that kill the most people by far,” says Jose-Luis Jimenez, a University of Colorado researcher also involved with the Pasadena site.
Aerosols largely are chemicals that arose from the reaction in the atmosphere of other compounds either released from human activities or from plants. The reactions of these chemicals has proved one of the most mysterious and important questions in atmospheric science today. Unlike carbon dioxide, which lasts for decades and has a relatively simple effect on climate, aerosols come in a dizzying array, last for about a week and may either warm or cool their surroundings.
Making things even more complicated, the air is not stagnant. The haze around Bakersfield or Los Angeles has changed and reacted so many times that it is hard to say where it all started.
Stutz and Goldstein say it is crucial to find the place where the emissions originate and how it they transform in the atmosphere to create a picture of how the air pollution forms and how to improve it. So the towers are placed in key locations where gases from plants are mixing with those from industry or transportation to form smog.
But, of course, the sky is a pretty big laboratory. So in addition to the highly sensitive and precise sniffers attached to towers, CalNex used four planes and a large 270-foot ship called Atlantis to create a dynamic image of how pollution moves. The planes flew both day and night as high as an airliner and as low as a crop duster to try and capture the complex dynamic of mixing and reacting air. Meanwhile, Atlantis trolled about along the coast, through San Francisco Bay and up the Sacramento River delta to collect some of the most accurate measurements ever taken of California’s offshore and inland pollution.
Data sets on this scale are different from those collected by an average university team. In essence, it’s a comprehensive look at that moment in time of the state’s air — a sort of library that future scientists can look at from hundreds of angles undreamed of by the original teams.
“My guess is that we have thought of maybe half the things we are going to be doing with the data. As we learn from the data we will discover more that we should investigate,” says Goldstein.
Another question is nitrogen oxides, the yin to the organic aerosol yang. Without nitrogen oxides, the off-gassing from crops and trees would not form deadly ozone and aerosols. But unlike many previous studies, CalNex was not just focused on the pollution that makes the sky gray and children sick. It was also focused on a more ambitious goal — understanding the role of California’s air pollution in climate change.
“The combination of trying to look at air quality and climate is sort of the new aspect of CalNex that we haven’t seen before in California,” says Eileen McCauley, a manager at the state’s ARB.
“These two issues are closely related,” says Parrish. “Ozone is an important air pollutant but it’s also the third most important greenhouse gas, depending on how you count.”
Carbon dioxide and methane are undoubtedly the dominant engines of climate change and their role is well understood. But other pollutants like aerosols and ozone are trickier. For instance, black carbon — a dirty brown sort of aerosol — enhances the sun’s energy, trapping it and spreading it around like a cast iron pot. But most other aerosols are lighter colored and thus reflect heat, reducing by as much as half the effects of climate warming due to greenhouse gases.
But how long will they do that? What happens when the cooling aerosols are outpaced by warming gases? And most importantly, since these aerosols are a health risk, what happens to the climate if we drastically reduce them?
These are some of the questions that the CalNex’s massive database will endeavor to answer. The data were collected in May and June of 2010 (one plane made a slight detour in order to collect crucial data from above the Deepwater Horizon oil spill). One year later, in May, the scientists gathered to share their first results and brainstorm about what else to do with the data.
All results will be merged together onto one timeline so that any scientist can immediately see all the sites at once. In addition that data will be merged with a cooperative simultaneous project called Carbonaceous Aerosol and Radiative Effects Study (CARES) funded by the Department of Energy.
All of this data will result in a series of official papers as early as mid 2012 aimed at informing policymakers. Others will simply focus on basic science questions.
“I really do think that we’re going to write a paper that says, ‘If you want to make the San Joaquin Valley cleaner, here are your choices.’ That honestly is what I am excited about,” says Cohen. “In fact, I spent this morning talking to my grad student about the shape of that paper.”