They say a picture is worth a thousand words. In the case of Professor Dennis Baldocchi’s biometerology lab, thousands of pictures could mean thousands of dollars saved for effectively measuring carbon credits. Since 2010, the lab has been monitoring the restoration of wetlands in the Sacramento-San Joaquin River Delta to measure their viability as carbon farms. And they’re getting close to finding methods that can make predicting the “productivity” of these areas much easier and more cost efficient.
This timelapse video shows the gradual change in Mayberry Wetland from November 2010 through March 2014. As cattails spring up and vegetation expands dramatically over time, greenhouse gases are taken out of the atmosphere through photosynthesis.Beginning around the 1850s, much of the Sacramento-San Joaquin River Delta was drained and levied for agricultural use, and today the area is nearly 73% farmland. This traditional farming of the land is widely accepted as unsustainable in the long run, though, because it has caused significant land subsidence (sinking), which can result in flooding and put California's water supply in danger if levees break. Now, because of these issues as well as the potential for carbon farming, there is strong interest in restoring part of the Delta back to wetland. Both farmed crops and wetland vegetation do pull in carbon from the atmosphere through photosynthesis. However, the drained soil in farmlands allows in more oxygen, which greatly speeds up decomposition of the crops after they die; and during that decomposition the carbon taken up by the crops (as well as carbon stored from when the land was previously a wetland) actually gets released back into the air. It is this faster loss of carbon from the soil that is causing the subsidence. Alternatively, the soils of wetlands are low in oxygen because they are flooded, and this strongly reduces decomposition and thus the release of carbon dioxide.

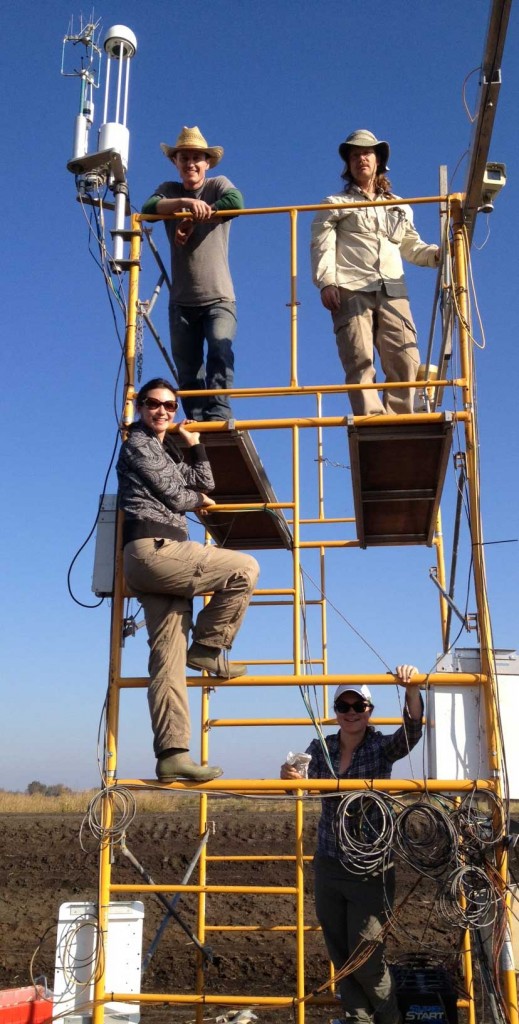
Lab members Cove Sturtevant, Joe Verfaillie, Patty Oikawa, and Sara Knox set up an eddy covariance tower at a newly restored wetland on Twitchell Island. The towers hold equipment that measures the amount of greenhouse gases being taken up by the ecosystem, which can eventually help determine how many carbon credits the land can earn.
For this reason, wetland restoration is included in the California Cap-and-Trade Program, which has been developed by the California Air Resources Board to help California reduce greenhouse gas (GHG) emissions to 1990 levels by the year 2020 (as mandated by CA Assembly Bill 32). Meanwhile, however, the soil in wetlands also releases methane, another (and more potent) greenhouse gas.
Measurements about the quantity of GHGs being taken up by a wetland are needed in order to determine how many carbon credits can be awarded for any given space. Using sophisticated instruments on “eddy covariance towers,” Professor Baldocchi’s lab measures the storage and release of carbon dioxide, methane, and other gases in the wetland over time. But these measurements are scientifically rigorous and expensive, and the lab is working towards a better solution for widespread measurement of GHG reduction in wetlands and other ecosystems.
According to Cove Sturtevant, a Postdoctoral Scientist in the biometerology lab, a simple camera may be the answer. Along with their precise measurements, the lab also captures images of the spaces they monitor every half hour. Joe Verfaillie, the biometeorology lab’s Developmental Technician, programs off-the-shelf digital cameras to take photos every half hour. Using a “greenness imagery software” developed by the Phenocam Network at Harvard, the lab can then measure the “greenness” of every photo taken as the wetland is restored. Comparing the change in “greenness” in the images to the actual measurements of the change in GHGs in the wetland, they are creating a data metric that will allow for estimation of how much GHG an ecosystem is taking out of the atmosphere without the expensive scientific equipment. Eventually, reliable data can be gleaned from the camera images and just a few other simple measurements.

This greenness-photosynthesis plot shows the relationship between camera “greenness” determined from images of an ecosystem and its actual “productivity”—the amount of greenhouse gases taken up. Comparing the two will result in a data model that allows camera images to accurately predict how many carbon credits a piece of land can earn. *Plot created by Pascal Polonik, an undergraduate student in the biometeorology lab.
As Sturtevant puts it, “If you can just set up a camera at a site that’s being turned into a wetland to gain carbon credits—a camera that’s cheap and easy to install—it makes granting carbon credits to that restoration project much more feasible.”
ESPM postdoctoral fellow Patty Oikawa is currently working on a model that will make this process feasible very soon. The model will be incorporated into a carbon capture protocol, a document outlining the specific process for calculating carbon credits for a particular wetland restoration project, including measurement requirements for the project manager and other regulations. The protocol, which is a collaborative effort between the biometeorology lab group, state agency scientists and companies working in the voluntary and state carbon markets, will be submitted to California's Air Resources Board in January of next year.
In addition to three wetland sites, the biometeorology lab is conducting similar tests on several other sites, including an alfalfa field, pastures, and a rice field. Graduate student Sarah Knox’s research, for example, focuses on an analysis of the difference in net carbon storage and release of GHGs in these different land use types. Her research will provide insight into whether agricultural land must be restored to wetland, or whether certain flooded agriculture sites may also be effective in harnessing carbon while also still producing food.
More information: For a list of field sites and field notes and photos, visit the Biometerology lab website.
